The Small Business Owner’s Secret to Staying in Control Without Drowning in Data
Why Micro-Metrics Beat “Big Data”
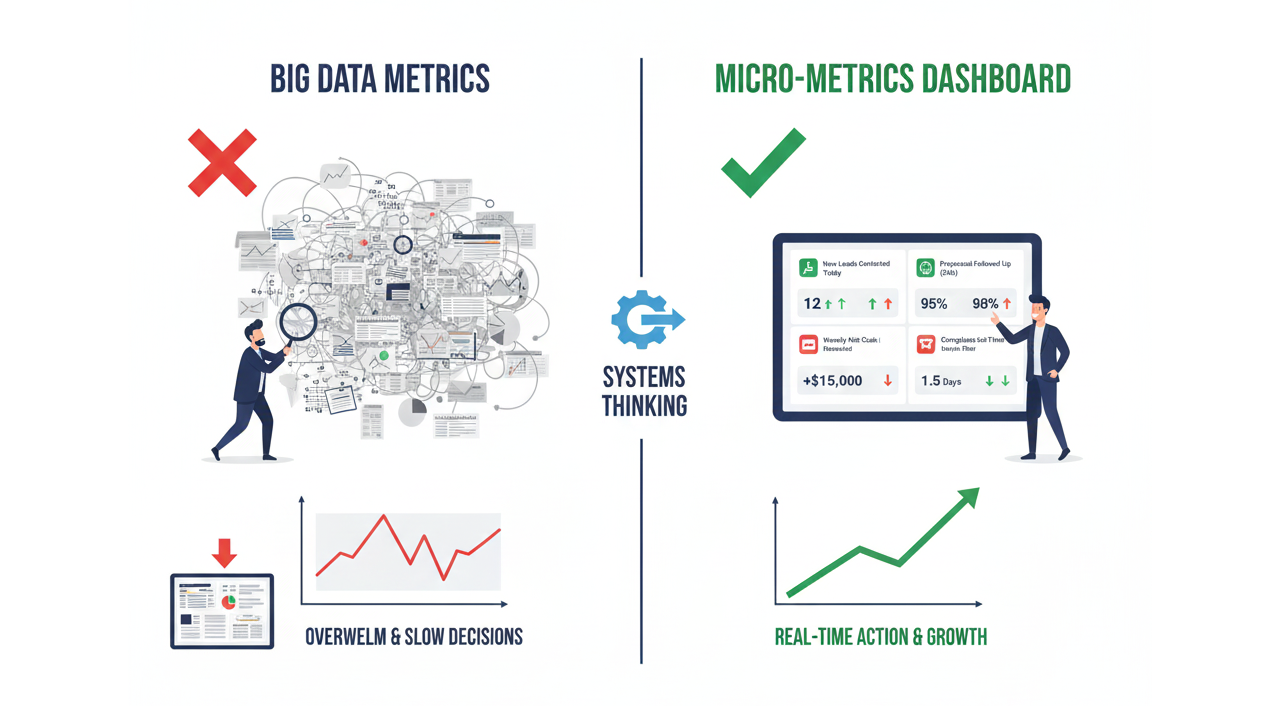
Let’s be honest — most small business owners either:
- Track too much (and get overwhelmed), or
- Track too little (and fly blind).
The truth?
Success isn’t about having more data — it’s about tracking the right data.
A Micro-Metrics Dashboard gives you a real-time pulse on the handful of numbers that actually move your cash flow and growth.
Metrics vs. Micro-Metrics
Metrics: Big-picture numbers you check monthly or quarterly.
(Example: Total Sales, Annual Revenue)
Micro-Metrics: Small, actionable signals you track daily or weekly.
(Example: “Qualified Leads Contacted in the Last 48 Hours” — something you can fix today.)
Why It Works
- Speed – You spot problems before they snowball.
- Clarity – Everyone knows what matters this week.
- Accountability – Performance is visible in real time.
- Agility – You can pivot midweek instead of post-quarter.
How to Build a Micro-Metrics Dashboard
Step 1 — Identify Your Core Levers
Focus on the 3 areas that directly impact your bank balance:
- Leads — new inquiries, calls, or signups.
- Conversions — quotes sent vs. accepted.
- Retention — repeat orders or churn.
If improving each by 10% moves your profit, it belongs on your dashboard.
Step 2 — Pick 5–7 Micro-Metrics Max
Keep it focused. Example mix:
Sales:
- New leads contacted today
- % of proposals followed up within 24 hours
Operations:
- Average turnaround time this week
- % of on-time deliveries
Customer Service:
- Complaints unresolved after 48 hours
Finance:
- Weekly net cash flow (cash in vs. out)
Step 3 — Set the Right Frequency
- Daily: New leads, follow-ups, on-time delivery rate
- Weekly: Repeat purchase rate, net cash flow
If it doesn’t change weekly, it’s not a micro-metric.
Step 4 — Make It Visible
Numbers must be easy to see and impossible to ignore:
- A TV screen in your office
- A shared Google Sheet
- Or even a daily WhatsApp/Slack update
Visibility drives accountability.
Step 5 — Tie Each Metric to Action
Every number should trigger a decision.
Example:
If “Follow-ups within 24 hours” drops below 80%, your sales manager calls a huddle today to fix it.
Real Example: A 15% Revenue Jump
A mid-sized event company switched from monthly reviews to a 6-metric daily dashboard:
- Leads contacted
- Quotes sent
- Quotes followed up
- Bookings confirmed
- Event issues logged
- Daily cash position
In just 90 days:
- Lead follow-ups got 22% faster
- Operational delays dropped 30%
- Revenue grew 15% — with zero new hires
Pro Tips
- Start simple — track manually before automating.
- Make it a ritual — review daily or weekly, same time.
- Celebrate micro-wins — what gets recognized, improves.
- Keep it simple — if you need to explain it, drop it.
Pitfalls to Avoid
- Tracking vanity metrics (like total visitors with no sales link)
- Letting dashboards get cluttered
- Collecting data but never acting on it
The Bottom Line
For small businesses, reacting late costs money.
A Micro-Metrics Dashboard turns data into action — keeping you agile, focused, and financially in control every single week.